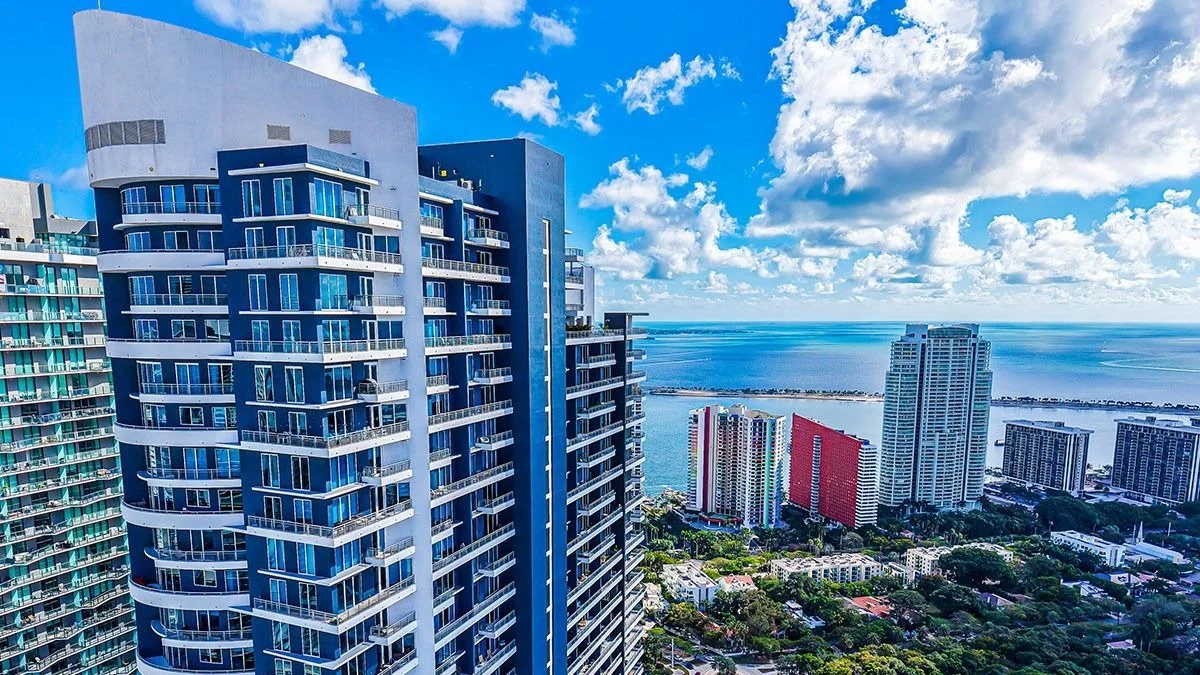
Quick answer: Almost every listing for this building quotes a monthly dues figure. That figure is the least informative number attached to it. Infinity was completed in 2008, which means its first budgets were written before the market it opened into existed, and the interesting document is the sequence of budgets since.
A monthly figure is a snapshot of a decision the board made once. The trajectory is a record of how the building has been run for nearly two decades, and on this cohort of towers those two things can point in opposite directions.
The basics
| Detail | |
|---|---|
| Address | 60 SW 13th Street |
| Built | 2008 |
| Storeys | 53 |
| Units | 459 |
| 25-year structural trigger | about 2033 |
Fifty-three storeys carrying 459 residences works out at roughly nine per floor, which puts it in the same structural family as most towers built in Brickell during that cycle: efficient floorplates, a large amenity deck, and a service load that scales with unit count rather than with square footage.
The 2008 cohort, and why it is a category
Towers completed in Miami between roughly 2007 and 2009 share a history that has nothing to do with how they were built and everything to do with when they were handed over.
Construction started in a market that priced pre-construction contracts as though absorption were guaranteed. Completion arrived after that market stopped. The consequences were operational rather than structural, and they compound:
| What happened | What it left behind |
|---|---|
| Unsold developer inventory at handover | Budgets carried by a developer with an incentive to keep dues low while selling |
| Developer-controlled board in the early years | Operating assumptions set by the seller, not by the owners |
| Reserves waived annually, which was then lawful | A funding gap that grows quietly for a decade |
| Turnover to owner control mid-crisis | A first owner board inheriting numbers it did not set |
None of that is an accusation about any particular building. It is the shape of the cohort, and it is why a dues figure from a 2008 tower needs a decade and a half of context before it means anything.
It is also why two towers of the same age, the same size and the same construction quality can present entirely different financial positions today. The variable was never the building. It was how quickly the owners took control, and what they did in the first budget they wrote themselves.
What the budget history actually shows
Ask for the last five to eight annual budgets and read them in sequence. Four patterns account for nearly everything you will see.
- Flat for years, then a step change. The building deferred, then caught up. The step is where reserves or insurance were finally priced honestly. This is normal and, once it has happened, reassuring.
- A steady climb roughly tracking insurance. The board has been repricing as it goes. This is the healthiest pattern and the one that produces the fewest surprises.
- Flat throughout, including through the insurance years. Something is absorbing the difference. Find out what. Usually it is the reserve line.
- Falling. Almost always a reserve waiver, a service cut, or both.
Then find the reserve line specifically, and the funding percentage the budget meets against the study’s recommendation. The change in the law that removed annual reserve waivers for structural components applies to every Florida association, and the cohort it affects most is exactly this one: buildings old enough to have waived for years and new enough that nobody has yet demanded the money.
Our guide to HOA restrictions for Florida investors covers the rest of what the documents govern.
The 2033 date is far, but the funding is not
A 2008 certificate of occupancy puts the statutory milestone around 2033. Seven years out, and outside a typical hold.
That distance is genuinely reassuring on structure and irrelevant on cash. The reserve study covering the same components is a present obligation, not a 2033 one, and the money for the work the study identifies is meant to accumulate over the years in between rather than to appear when the engineer arrives.
So the questions split cleanly:
| Question | When it is answered |
|---|---|
| Is the structure sound? | 2033, by an engineer |
| Is the building paying for what the structure will need? | Now, in the budget, every year |
A buyer who reads the second question as though it were the first concludes there is nothing to check here for seven years. That is the specific error this vintage invites. We set out the mechanism in our SB 4-D assessment wave update.
Reading a 459-unit denominator
| Capital cost | Per owner across 459 units |
|---|---|
| $1,000,000 | roughly $2,200 |
| $3,000,000 | roughly $6,500 |
| $5,000,000 | roughly $10,900 |
Read that column as long division rather than as a forecast.
A large base is genuine protection on arithmetic. What it costs you is speed: 459 owners take longer to agree to spend money than 170 do, and a board that needs a vote for a material alteration on a building this size will find the delay itself expensive when construction pricing moves. Large associations tend to under-react and then over-correct, which is the pattern the budget history will show if it is present.
Strengths and weaknesses
Advantages. A large denominator that spreads capital costs efficiently. A milestone far enough out that structural uncertainty is not the near-term issue. Post-2004 construction, which insures better than the 1990s and mid-2000s stock nearby. And a documentary trail long enough to actually judge the building on, which is not true of anything delivered in the last five years.
Disadvantages. The cohort history means early budgets were set by a party that was still selling, and any waived years are still in the building’s past. Governance on 459 units is slow. The 2033 date encourages buyers and boards alike to treat funding as a later problem. And a large amenity programme from that cycle costs money to run whatever the market does.
What to ask for, and in what order
- The last five to eight annual budgets, in sequence rather than the current one alone.
- The structural integrity reserve study and the funding percentage the budget meets against it.
- Board minutes for three years, particularly any discussion of reserve funding levels.
- The master policy declarations page, its deductible, and the last wind mitigation report.
- The rules on leasing, minimum term and approval, which decide whether your intended use is permitted at all.
Read them in that order. The budgets tell you how the building has been run; everything after that tells you what it will cost you.
Two of the six carry disproportionate weight on a tower of this vintage. The budget sequence is the only document that shows behaviour over time rather than position at a moment, and the reserve funding percentage is the only number that converts that behaviour into a figure. Everything else in the file describes the building. Those two describe the people running it, and on a 459-unit association that is the variable a buyer has least ability to change after closing.
Where the leasing rules are concerned, read them against your actual plan rather than against the market. A minimum lease term and an approval process determine whether a unit works as a rental at all, and the arithmetic in our gross versus net yield guide only means something once those two answers are known.
What should stop you
- A dues figure quoted without any budget history offered.
- A reserve line that does not appear separately at all.
- Flat dues across 2022 to 2025, the years when Florida insurance repriced.
- Minutes with no discussion of reserve funding on a building of this vintage.
- A seller who describes the 2033 milestone as the reason there is nothing to check.
Our reading: this is a sound structural proposition with a financial history worth an hour of reading. The building’s age puts the structural question comfortably in the future and the funding question firmly in the present, and buyers routinely get that the wrong way round.
For a Brickell building whose milestone falls inside a normal hold, see our Vue at Brickell review. For one already past its deadline, see our Santa Maria review.
Frequently Asked Questions
2008. It is a 53-storey tower of 459 residences at 60 SW 13th Street.
Buildings finished in 2008 opened into a collapsed market with unsold inventory and developer-controlled boards. Their first operating budgets were written on pre-crash assumptions, and what happened to those budgets afterwards is a matter of record.
The last five to eight annual budgets side by side. A dues figure on its own says nothing; the direction and speed of change say almost everything.
On the 25-year coastal trigger a 2008 certificate of occupancy points to roughly 2033. That is outside most hold periods but well inside the reserve funding horizon.
It helps on arithmetic and complicates governance. Capital costs divide across a large base, but a large owner base is slower to agree on spending them.
Sources: address, build year, storey count and unit count from Miami condominium market records for Infinity at Brickell, 60 SW 13th Street. The 2033 figure is our calculation from the statutory trigger, not a date published by the association. Per-owner figures are 459 divided into a hypothetical sum. The cohort description reflects the general history of Miami towers completed in that window, not audited figures for this association.
Ask for eight years of budgets
Send a unit at Infinity at Brickell or any 2007 to 2009 Miami tower. We read the budget sequence and the reserve position before you offer.