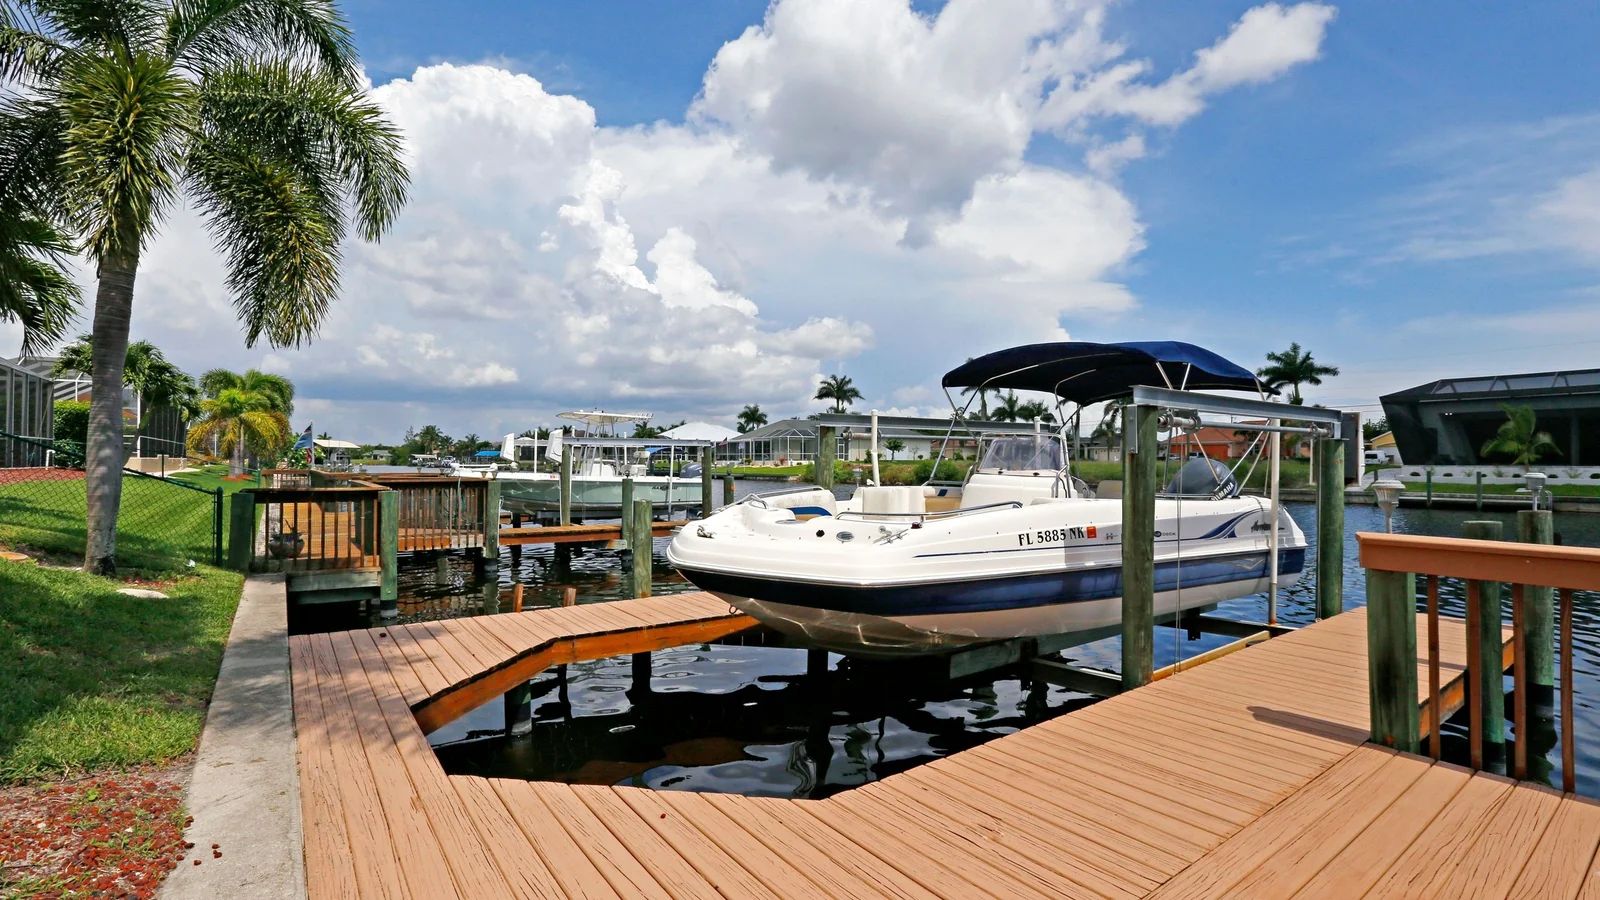
Quick answer: Cape Coral is the epicenter of Southwest Florida’s 8% to 15% repricing, with more than 40% of listings cut and off-water entries at $300,000 to $420,000. The discount is genuine compensation for insurance and flood costs that must be individually verified: a bindable quote and a post-2015 roof separate the bargains from the traps more reliably than any price comparison.
Cape Coral was engineered for exactly the moment it is now failing to market correctly. A city built on more than 400 miles of canals, platted decades ago for far more homes than exist, it spent 2020 through 2022 as one of America’s fastest-appreciating markets and has spent the years since as Florida’s most visible repricing. The statistics that define Southwest Florida’s correction, 8% to 15% off peak, more than 40% of listings cut, are at their most concentrated here.
What the headlines miss is that Cape Coral’s discount is not one number. A 2019-built home with a documented wind mitigation report, a transferable flood policy, and an elevation certificate trades close to its 2023 value and insures for a manageable figure. A 2004-built home three streets away, original roof, no storm documentation, lists 18% below peak and cannot bind coverage at a price any rental model survives. Both appear in the same “Cape Coral discount” average; only one is an investment.
This guide maps the market’s structure: the canal hierarchy that drives pricing, the insurance arithmetic that decides deals, the seasonal rental economy, worked yield scenarios, and the verification list that separates the two houses above. It pairs with the Lee County STR rules, the flood zone guide, and the 2026 repricing playbook for the statewide context.
Why is the center of the Southwest Florida repricing
Cape Coral is the repricing’s center because it was the boom’s center: prices roughly doubled from 2020 to 2022 on speculative demand, and the market has since surrendered 8% to 15% from peak as insurance repricing, storm memory, and investor exits stacked together. Over 40% of active Southwest Florida listings now carry at least one reduction.
| Phase | Years | Price effect |
|---|---|---|
| Boom | 2020 to 2022 | roughly +100% |
| Shock | 2022 to 2024 | insurance repriced, documentation demanded |
| Correction | 2024 to 2026 | -8% to -15% from peak |
The mechanics, in sequence:
- The boom overshot. Remote-work migration and sub-3% mortgages pushed a workforce city to resort pricing, with waterfront speculation leading.
- Insurance repriced the carry. Wind premiums of $3,000 to $6,000 and flood coverage of $1,000 to $4,000 turned marginal rental models negative, exactly the dynamic covered in our insurance cost guide.
- Storm history forced documentation. Post-2022 buyers demand roof ages, repair records, and elevation certificates, and homes without them price as risks rather than houses.
- Investors sold into thin season. Off-season listing gluts met reduced buyer pools, and 33.6% statewide price-cut rates run above 40% here.
Our underwriting draws one conclusion from that sequence: Cape Coral in 2026 is a verification market, not a timing market. The citywide discount of 8% to 15% is an average of two populations, insurable homes with documented roofs and transferable flood policies that have barely repriced, and uninsurable or undocumented homes discounting 15% to 20% and still sitting past 120 days on market. Buyers who verify before offering are choosing from the first population at prices influenced by the second, which is the entire arbitrage. Buyers who chase the deepest sticker discount are usually buying the second population’s problems at what only looks like a bargain, and the $5,000-per-year insurance delta between the two groups compounds into more than the entire sticker discount across a normal five-year hold.
How does the canal hierarchy structure pricing
Canal position typically drives $150,000 to $300,000 of price spread between otherwise comparable Cape Coral homes, and the hierarchy runs in four tiers: gulf-access with sailboat clearance, gulf-access behind bridges, freshwater canal, and off-water. Rental ceilings and buyer pools differ as much as prices do.
| Tier | Typical 3-bed price | Rental profile | Investment character |
|---|---|---|---|
| Gulf-access, no bridges | $650K to $1M+ | Peak seasonal, boating tenants | Appreciation and ceiling |
| Gulf-access, bridge-restricted | $500K to $700K | Strong seasonal | Balanced |
| Freshwater canal | $380K to $500K | Good seasonal, views | Value waterfront |
| Off-water | $300K to $420K | Year-round workforce + seasonal | Yield engine |
Three tier rules compress our data on the hierarchy:
- Yield concentrates at the bottom two tiers; ceiling concentrates at the top two
- Every bridge between a dock and open water subtracts from the gulf-access premium
- Insurance and dock upkeep scale with tier faster than rents do
Reading the four tiers as an investor rather than a boater changes most conclusions buyers arrive with. Gulf-access commands the headlines and the weekly-rate records, but its premium prices in a boating buyer pool that thins sharply in downturns, and its insurance and dock maintenance run heavier. Off-water and freshwater stock rents to the year-round workforce that services the city plus the seasonal overflow, nets higher yields on lower bases, and resells into a wider pool. Our data consistently shows first-time Cape Coral investors overpaying for the third tier’s romance and underpricing the fourth tier’s arithmetic; the disciplined move is to let the strategy pick the tier, then verify ride time and bridge clearance only when the model actually monetizes them.
What does insurance really cost, and how does it decide deals?
Insurance typically costs $4,000 to $10,000 all-in on a Cape Coral rental, combining wind and homeowners coverage at $3,000 to $6,000 with flood at $1,000 to $4,000, and the figure varies more by roof age and elevation than by purchase price. A pre-2010 roof can double the quote or block coverage entirely.
The variables that move a specific home’s number, in order of force:
- Roof age and material. Post-2015 roofs price best; pre-2010 roofs face surcharges, exclusions, or refusals. On a $380,000 purchase, a $25,000 roof replacement that cuts $2,500 of annual premium pays back in a decade and unlocks bindable coverage today.
- Wind mitigation features. Documented straps, deck attachment, and opening protection commonly cut wind premiums 15% to 40%; the inspection costs about $150.
- Flood zone and elevation. Zone, base flood elevation, and the home’s certificate drive the flood line; an assumable existing flood policy at a grandfathered rate is a genuine transferable asset worth asking for in every offer.
- Claims and repair history. Documented, permitted storm repairs read as strength; undocumented work reads as unpriceable risk.
| Same street, same price | Home A | Home B |
|---|---|---|
| Roof | 2021, mitigation report | 2006, undocumented |
| Flood policy | Transferable | New, full rate |
| All-in insurance | $4,300 | $9,100 with exclusions |
| Net yield on identical rent | 5.2% | 3.1% |
A buyer scenario from our own client files shows exactly the stakes in those table rows. Two near-identical $395,000 freshwater-canal listings sat four streets apart this spring: one with a 2021 roof, wind mitigation report, and a transferable flood policy quoted $4,300 all-in; the other, 2006 roof and no documentation, quoted $9,100 with exclusions before one carrier declined outright. On identical rents, the first home netted 5.2% and the second 3.1%, a $2,300 annual gap that no negotiable list-price difference could close. The first buyer also borrowed more cheaply, because the lender read the same file. Insurance is not a line item in Cape Coral; it is the underwriting verdict, and the flood zone guide carries the elevation homework in full.
What rental strategies actually work
Three rental models typically clear honest underwriting in Cape Coral in 2026: seasonal short-term rental on canal pool homes grossing $55,000 to $80,000, year-round workforce tenancy on off-water stock at $2,100 to $2,300 per month, and the winter furnished-monthly hybrid at $3,500 to $5,000. Season runs November through April and carries most of the revenue in every model.
Seasonal STR. A gulf-access pool home renting $2,500 to $4,500 per week in season, with registration through the city, a DBPR license, and the roughly 12% transient stack per the Lee County rules, grosses $55,000 to $80,000 at realistic occupancy. Management at 20% to 25%, the tax stack, pool and dock upkeep, and insurance endorsed for transient use compress net yields to 4% to 5.5% on mid-tier waterfront, with the model living or dying on season-week occupancy.
Workforce long-term. An off-water $330,000 3-bed renting $2,100 to $2,300 monthly to the construction, marine, and service workforce grosses near 8%, and nets 4.5% to 5.5% where insurance binds sanely. This is the boring engine our underwriting keeps recommending: no seasonality risk, no license, tenant demand tied to the city’s own rebuilding economy.
Furnished monthly hybrid. Snowbirds taking December-through-March at $3,500 to $5,000 per month, with 30-day-plus stays sidestepping the transient tax stack and DBPR licensing, then annual-rate tenancy or owner use off-season. On several client models this nets within half a point of full STR at a fraction of the operating friction, the same pattern we document in Ocala and across the short-term versus long-term comparison.
What does the net yield math look like on a real purchase?
A verified off-water Cape Coral purchase typically nets 4.5% to 5.5% in 2026, seasonal waterfront STR nets 4% to 5.5% with wider variance, and every scenario is decided by the insurance line rather than the rent line. Two worked examples from our underwriting frame the band, both priced at achieved rents:
- Scenario 1: $330K off-water workforce, 3.8% to 4.9% by negotiated basis
- Scenario 2: $430K freshwater seasonal hybrid, 3.8% to 4.6% with assumable flood
Scenario 1, off-water workforce. Purchase at $330,000 after negotiating 6% off a cut listing, rent $2,200 monthly, gross $26,400 or 8.0%. Deductions: non-homestead property tax near $4,300, insurance bound at $4,100 with a 2018 roof and mitigation credits, management 9%, maintenance $2,000, vacancy 5%. Net lands near $12,600, a 3.8% yield unlevered, rising to 4.9% on the same math at a $300,000 negotiated basis, which is precisely why the negotiation playbook matters more here than anywhere in Florida: every negotiated dollar survives to the yield line.
Scenario 2, freshwater canal seasonal hybrid. Purchase at $430,000, winter months at $4,200, shoulder and summer at $2,400 furnished, blended gross near $38,000. Deductions: tax near $5,600, insurance $5,200 including flood, management on the seasonal share, furnishing amortization $3,500, utilities and pool $4,800. Net lands near $16,500, a 3.8% yield that reaches 4.6% when the buyer captures an assumable flood policy and negotiates the basis to $405,000. The rental yield guide supplies the full framework, and both scenarios assume achieved rents from local managers rather than listing-site projections.
What must buyers verify before offering
Cape Coral verification typically costs $600 to $900 and two weeks, and it runs six items in a fixed order: roof documentation, bound insurance quotes, elevation certificate and flood zone, permitted repair history, utility assessment status, and the rental legality stack for the intended model. Skipping any of the six is how buyers purchase the wrong half of the discount.
The checklist our underwriting runs:
- Roof age with permits. The single largest insurability driver; demand the permit record, not the listing’s word.
- Bound wind and flood quotes. Real quotes on the actual address before contingencies are waived, per the insurance guide; ask whether the seller’s flood policy is assumable at its current rate.
- Elevation certificate. Existing certificates transfer free; new ones cost a few hundred dollars and can cut flood premiums materially.
- Permitted storm-repair history. Documented, closed permits for any post-2022 work; open or missing permits become your liability at resale.
- Utility expansion assessments. Parts of the city carry multi-thousand-dollar utility connection assessments on the tax bill; pull the parcel record and read every non-ad-valorem line, the same discipline our CDD fee guide teaches.
- Rental legality for the model. City registration, Lee County rules, and any HOA covenants; the HOA checklist structures the covenant read.
Insider tip: ask every listing agent one question first, “what year is the roof, and is the flood policy assumable?” The answer sorts the entire market in thirty seconds, and agents who cannot answer it are showing you the unverified half of the discount.
How does compare with Naples and the other SW Florida markets
Cape Coral trades depth of discount against polish: entries run $200,000 to $500,000 below comparable Naples product, yields net 1 to 2 points higher, and the buyer pool is broader, while Naples holds the appreciation ceiling, the luxury tenant, and the more storm-tested premium stock. Fort Myers sits between the two on price and character.
| Dimension | Cape Coral | Naples | Sarasota |
|---|---|---|---|
| Entry, rentable 3-bed | $300K to $420K | $500K to $800K+ | $350K to $450K |
| Net yield, typical | 4.5% to 5.5% | 1.5% to 3% | 3% to 4.5% |
| Discount from peak | Deepest, 10% to 15%+ | 8% to 12% | 8% to 14% |
| Tenant profile | Workforce + seasonal | Luxury seasonal | Retiree + seasonal |
| Character of risk | Insurance, flood, roof age | Price, luxury liquidity | Barrier-island condo stock |
Our analysis places the three markets on one axis: how much of the return arrives as monthly cash versus eventual exit. Cape Coral is the cash end of Southwest Florida, Naples the appreciation end, Sarasota the balance point, and the Charlotte County rules corridor between them offers Cape Coral arithmetic at even lower entries for buyers willing to trade market depth. Buyers comparing against inland alternatives should read Ocala and Lakeland, which deliver similar nets without the coastal insurance variance, and decide how much waterfront optionality is worth to the model.
What should a buyer do next
Verify one specific home this week rather than tracking the citywide discount, because the market’s information asymmetry is the whole opportunity: sellers with documented roofs, transferable flood policies, and bindable quotes are competing against neighbors who have none of the three, and the listings barely distinguish them. The six-item checklist above costs under $900.
The sequence our underwriting recommends:
- Shortlist two or three canal tiers against your strategy and budget band.
- Put the roof-and-flood question to every listing agent; expect half to filter out.
- Bind wind and flood quotes on the survivors, roughly $0 to quote and $150 for a mitigation inspection.
- Price offers off the negotiation playbook with every documented liability itemized in the cover note. If you would rather start from a screened list, request a free shortlist with your budget and strategy, and we will return specific Cape Coral properties with roof, flood, and insurance status already mapped within one business day.
Frequently Asked Questions
For buyers who verify before offering, yes: the market carries Florida's deepest discounts, 8% to 15% off peak with 40%+ of listings cut, and off-water entries at $300K to $420K netting 4.5% to 5.5%. The discount compensates insurance and flood costs that must be individually confirmed; unverified purchases capture the risk without the return.
Canal tier and insurability. Gulf-access without bridges runs $650K to $1M+, freshwater canal $380K to $500K, off-water $300K to $420K. Within any tier, roof age and flood documentation move insurance from roughly $4,000 to over $9,000 per year, which swings net yield by 1.5 to 2 points on identical rents.
Wind and homeowners at $3,000 to $6,000 plus flood at $1,000 to $4,000, so $4,000 to $10,000 all-in. Pre-2010 roofs double quotes or block coverage; wind mitigation reports cut premiums 15% to 40% for a $150 inspection; assumable flood policies at grandfathered rates are transferable assets worth requesting in every offer.
Yes, with city registration, a state DBPR license, and a transient tax stack near 12% on gross. Season runs November through April and carries most STR revenue. Furnished monthly stays of 30+ days sidestep the license and tax stack and often net within half a point of full STR at far less friction.
Let the strategy pick: off-water and freshwater stock nets the highest yields and rents year-round to the workforce; gulf-access earns the rental ceiling and appreciation but carries heavier insurance, dock costs, and a thinner resale pool. First-time investors overpay for gulf-access romance more often than any other Cape Coral mistake.
An off-water $330,000 3-bed at $2,200 rent nets roughly 3.8% at asking-price basis and 4.9% at a negotiated $300,000 basis with bound $4,100 insurance. Negotiated dollars survive straight to the yield line here, which is why offer discipline matters more in Cape Coral than anywhere else in Florida.
The roof. Age drives insurability, insurability drives the model, and listings systematically under-disclose it. Ask every agent the same first question: what year is the roof, and is the flood policy assumable? The answer sorts the market in thirty seconds.
Cash flow: Cape Coral, netting 4.5% to 5.5% against Naples at 1.5% to 3%. Appreciation ceiling and luxury liquidity: Naples. Same coast, opposite ends of the yield-versus-exit axis, and the honest answer for many portfolios is a deliberate split.
Get a Cape Coral shortlist with insurance mapped
Tell us your budget, canal tier, and strategy. We reply within one business day with specific homes, roof and flood status, and realistic insurance estimates.